We're the Shortest Distance Between You and an Acceptance Letter
Now with licensed official GRE® questions from ETS!
Now with licensed official GRE® questions from ETS!


We’re here to help you improve as fast as possible. With Magoosh, you’ll always be studying with the most updated, tried-and-tested materials, based on careful analysis of millions of students’ answers. We don’t overwhelm you with questions; we make every question count!
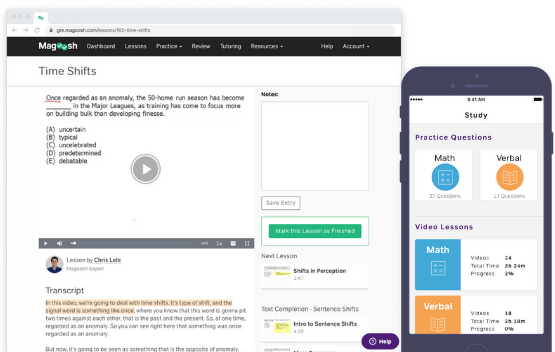
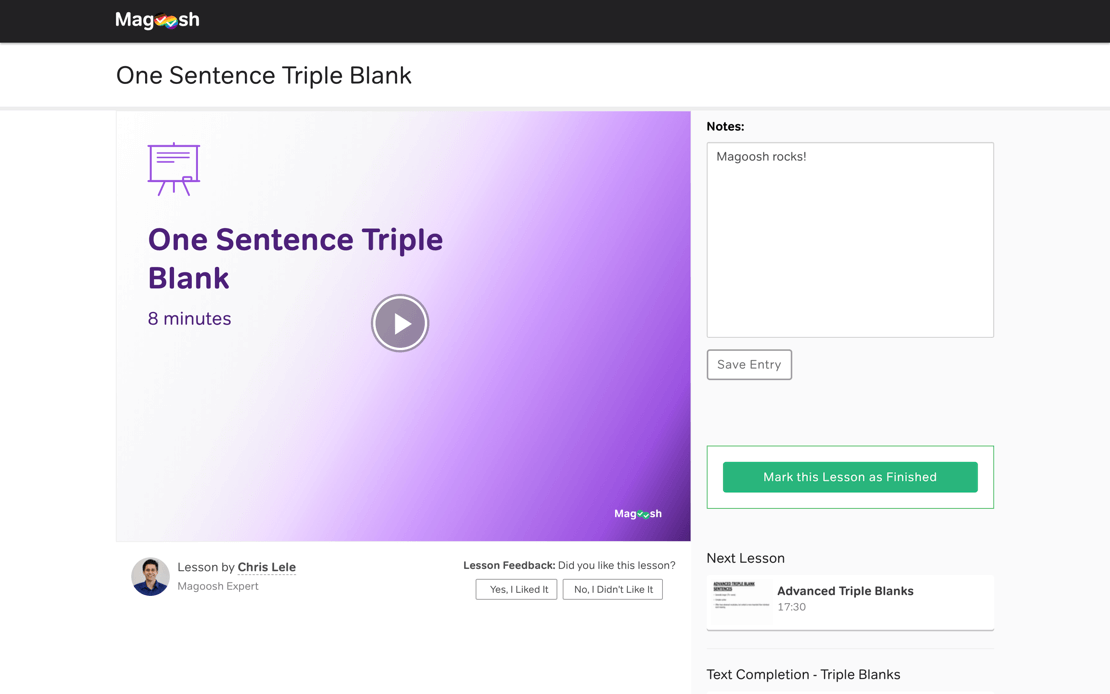
You can also take notes, bookmark, read transcripts, and give us feedback. We give you everything you need to make studying a breeze.

"Magoosh taught me all the math concepts that I had forgotten, I could not have done it without Magoosh! The lessons are all super relevant to the test, and the practice problems are so helpful! Amazing!"
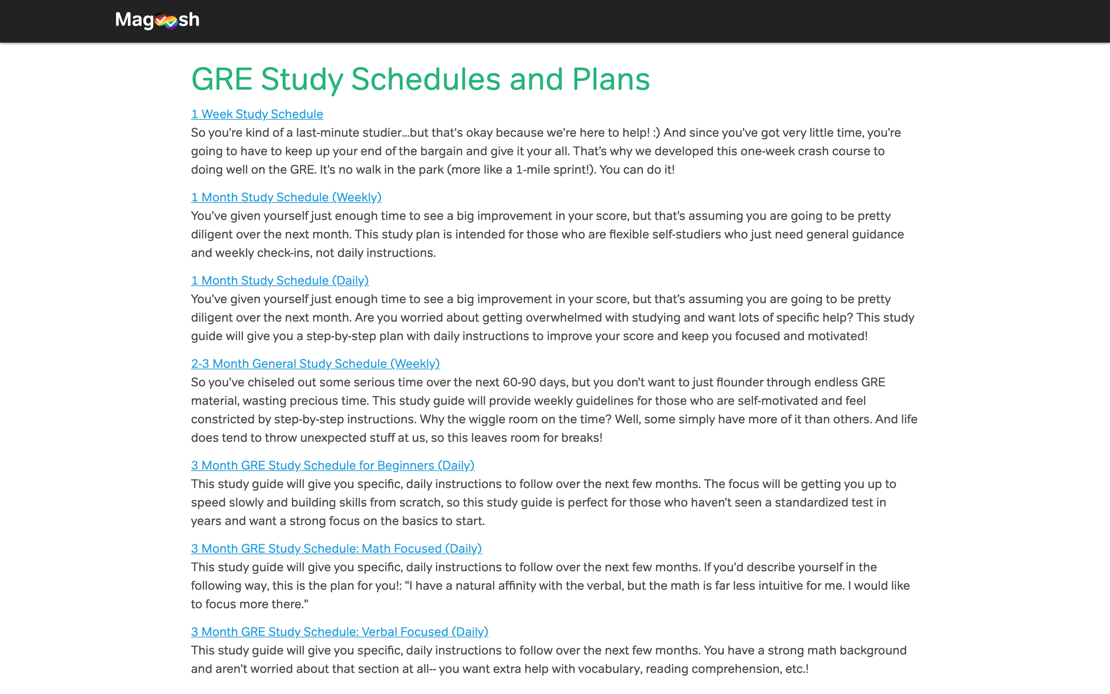
We make it easy for you to figure out where to start studying, and to stay motivated until test day. Our 11 carefully crafted study schedules accommodate varying study times and skills , so you'll always know the best way to study.

“Magoosh served as the facilitator and organizer of my studying. The video explanations for each question were an amazing resource, leaving no instances of confusion. Everything you could imagine needing and more was here. Thanks!”
Your practice experience will be as close to the real exam as possible. We maintain the highest question standards and have developed adaptive technology that simulates the official GRE.
Create customized practice sessions to drill yourself on specific subjects and difficulty levels. If you get stuck on anything, read our detailed text explanation, or watch the video tutorials that follow each and every question.

"The hard vocab in the practice problems really benefited me because on the actual test there was maybe one word I didn’t know. The video lessons and explanations were excellent. They cut to the chase and really just told me what I needed to know for the test."
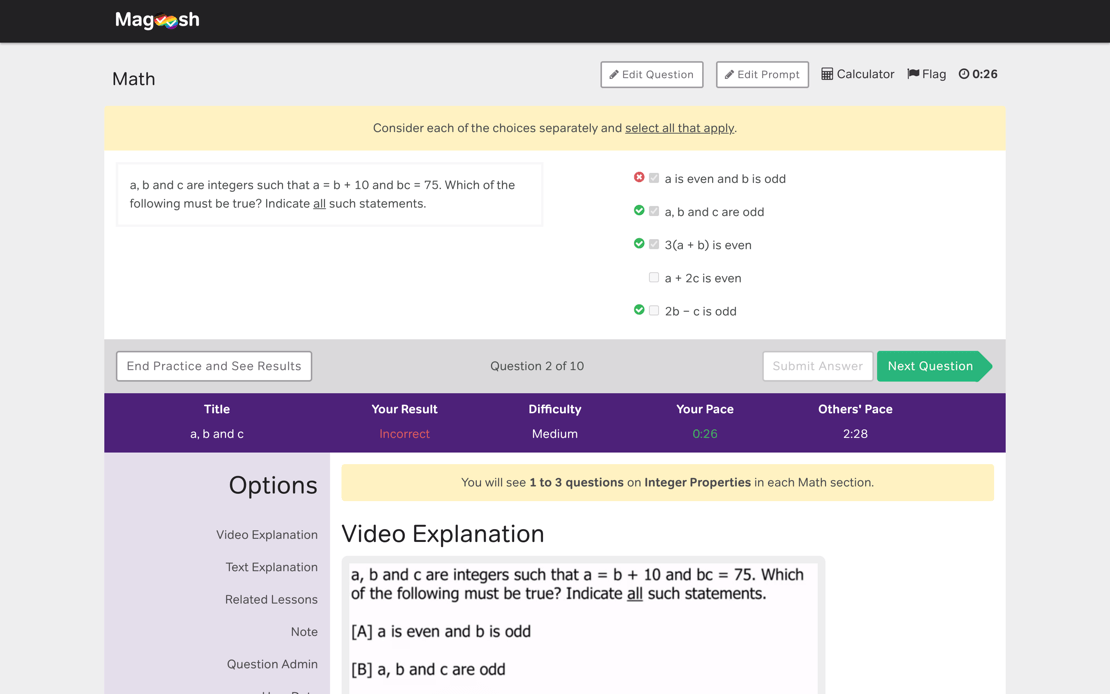
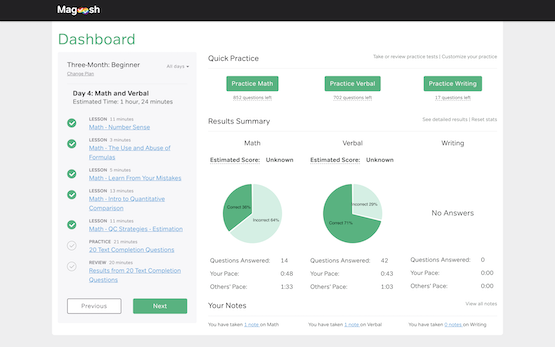
We help you keep track of your progress with an intuitive dashboard that estimates your score, compares your pace with other students, and tracks your learning.
Our smart review system allows you to review your performance based on time, difficulty, subject, or according to your own bookmarks, so you’ll know exactly what to focus on next.

"Magoosh was exactly what I needed to kickstart my GRE prep. The practice questions were incredibly addictive and the dashboard progress pie chart very encouraging. The quick turnaround time in email responses was very appreciated. "
7-day money back guarantee if you don't like the product for any reason
5 points score improvement guarantee
"Magoosh was actually in my price range."
"It looks just like the real test."
"You get to see exactly where you went wrong."
"You get to see all types of questions in the practice test before you actully face them in GRE."
"You really need to get in the heads of test makers, and these video explanations help you do that."
"The way they introduced concepts was very interesting, and they honestly made studying for the GRE kind of fun."
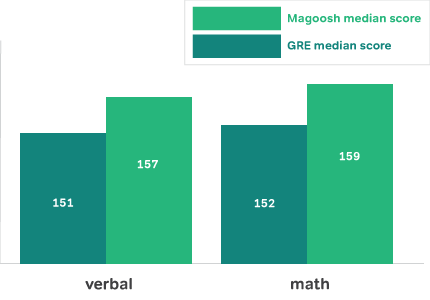
Magoosh students report a median score of 157 for verbal and 159 for math. That’s 6 points higher in each section than the median scores of all GRE takers.
In addition, 20% of our students earn a top 10% score in GRE. There are even 18 Magoosh alumni who got a perfect score. Let’s get you one step closer to that acceptance letter!
Zero risk: 7-day money back guarantee if you don't like the product for any reason
A lot of progress: +5 points improvement. Guaranteed!